
Authors: Ray-Yuan Chuang, PhD;1 Britany Tang, BS;1 Monique Hunter, MS;1 Stefan J. Green, PhD;2 Briana Benton, BS;1 and Juan Lopera, PhD1
1ATCC, Manassas, VA 20110
2University of Illinois at Chicago, Chicago, IL 60607
Introduction
Development of the tagged strains
Validation of the synthetic 16S rRNA tag profile
Production of the ATCC Spike-in Standards
Evaluating the influence of the spike-in standards on abundance profiles
Data normalization using the internal spike-in control
Discussion
References
Abstract
The natural complexity of microbial communities combined with the technical biases that arise during metagenomics workflows have challenged microbiome researchers in their ability to make meaningful measurements that are comparable across different laboratories. To help promote assay standardization and validation, ATCC has developed innovative spike-in standards for microbiome research. These internal controls were prepared as whole cell and nucleic acid mixtures composed of three genetically engineered bacterial strains (derived from Escherichia coli, Staphylococcus aureus, and Clostridium perfringens) that each contain a unique synthetic DNA tag that can be detected and quantified in routine 16S rRNA gene amplicon and shotgun sequencing assays. Here, we describe the construction and application of ATCC Spike-in Standards as a tool for quantitative metagenomic analysis.
Download a PDF of this application note
Download nowIntroduction
Advances in next-generation sequencing (NGS) technologies and computational tools have revolutionized bacterial genomics and microbiome research in tremendous ways, opening up applications in the areas of diagnostics, therapeutics, and environmental sciences. Despite the promise of these technologies, the analysis of metagenomic data remains challenging due to the technical biases that are introduced during sample preparation, nucleic acid extraction, PCR quantification, library preparation, sequencing, and bioinformatic analysis.1 Thus, there is a strong need to validate each stage of the workflow to ensure that metagenomic data are reliable and reproducible.
While mock community standards have proven useful as benchmarks for validating and optimizing microbiome workflows, the metagenomic data generated by high-throughput NGS are provided as compositional data (ie, relative abundances) rather than absolute quantities. Absolute quantitation could, however, be estimated by processing a microbial community with an exogenous internal control.2-4 To meet this need, ATCC developed novel spike-in standards comprising an even mix of genetically engineered bacterial strains that each contain a unique synthetic 16S rRNA tag. These unique tags enable the precise identification and quantification of spike-in reads, allowing for the normalization of data generated during 16S rRNA and shotgun† metagenomic sequencing assays. Here, we describe the development and quantification of the ATCC spike-in standards and demonstrate their use as internal controls throughout a routine microbiome analysis workflow (Figure 1).
† Terms such as shotgun sequencing and whole-genome sequencing (WGS) will be used interchangeably throughout the text.
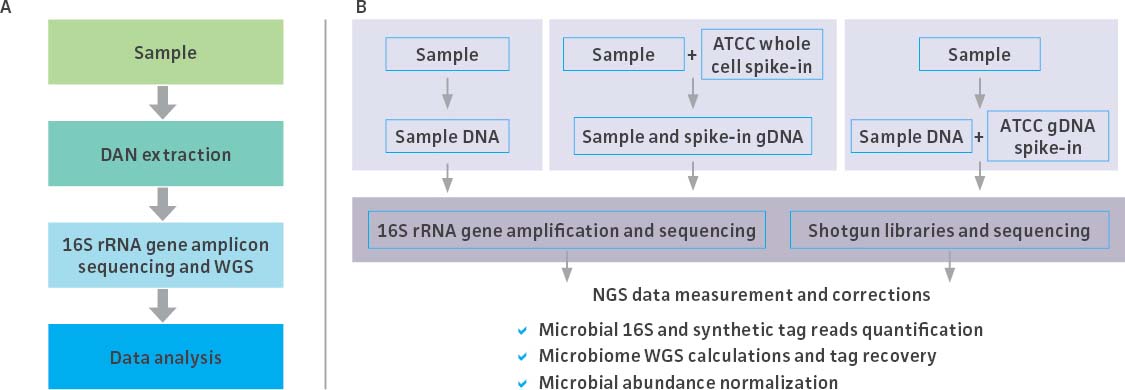
Figure 1. The typical stages of a microbiome workflow and the application of the spike-in controls at each step.
Development of the tagged strains
The ATCC created 3 unique synthetic 16S rRNA tag sequences mimicking native 16S rRNA genes from three bacterial strains (Escherichia coli, Clostridium perfringens, and Staphylococcus aureus). Each tag consists of 4 artificial variable regions (corresponding to V1 through V4 of the 16S rRNA gene) flanked by conserved regions for PCR amplification. The artificial sequences were created by randomly shuffling each variable region, and the uniqueness of the sequences was confirmed by comparison (ie, BLAST analysis) against the NCBI non-redundant sequence database. Following their development, the synthetic tag sequences were integrated into the genome of their cognate strains to create genetically engineered tagged strains (Figure 2; Table 1). The sequences for each synthetic tag can be found on the product technical data sheet. Only a single ribosomal RNA operon contains these synthetic tags; all other operons are wild type.
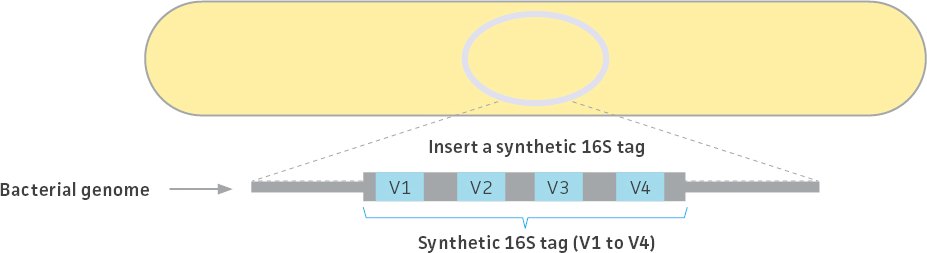
Figure 2. Production of tagged strains. A single copy of the synthetic 16S rRNA gene tag was integrated into the genome. The stability was monitored over more than ten passages and confirmed by whole-genome sequencing. All three bacterial genomes were completely sequenced and annotated.
Table 1. Properties of the three tagged strains
Validation of the synthetic 16S rRNA tag profile
To evaluate the ability of commonly used primer sets to amplify the synthetic tags, a mixture containing an even copy number of genomic DNA from the three tagged strains (ATCC MSA-1014) was analyzed by 16S rRNA gene amplicon sequencing (V1V2, V3V4, and V4 regions). The relative abundances were then compared to values obtained from Droplet Digital PCR (ddPCR; Bio-Rad) analysis (Figure 3A) employing assays specific to the tagged strains. The ddPCR absolute quantification data showed an approximately equal genomic DNA copy mixture among the three tagged genomes with a slightly higher percentage of the C. perfringens Tag 2 genome (36.38%) and a lower percentage of the S. aureus Tag 3 genome (29.78%). The sequencing results from both the V3V4 and V4 only regions revealed that the relative abundance among the three tagged genomes is similar to the values obtained from ddPCR analysis. In contrast, sequencing results from the V1V2 region showed a higher divergence between expected and observed abundance. In order to investigate the bias of 16S rRNA gene amplification, we analyzed the divergence from equal relative abundance by calculating ‘ideal scores’ (IS),5 which quantify the divergence of the observed output from the expected output. The higher the IS, the greater the divergence between expectation and observation. We examined 16S rRNA gene amplification reactions of gDNA that included both native and the synthetic 16S gene variable regions. The results showed a higher divergence between the expected and observed abundance when analyzing the V1V2 Tag amplicon sequence (higher scores represent a greater distortion) (Figure 3B). Two-way ANOVA by various regions indicated there is no significant difference when using the V3V4 Tag and V4 Tag amplicon sequences (data not shown). Since conserved regions are identical between synthetic tags and their cognate counterparts, the difference of IS between native 16S and synthetic 16S tags may be due to the efficiency of PCR amplification. This is especially significant in amplifying the V1V2 region.
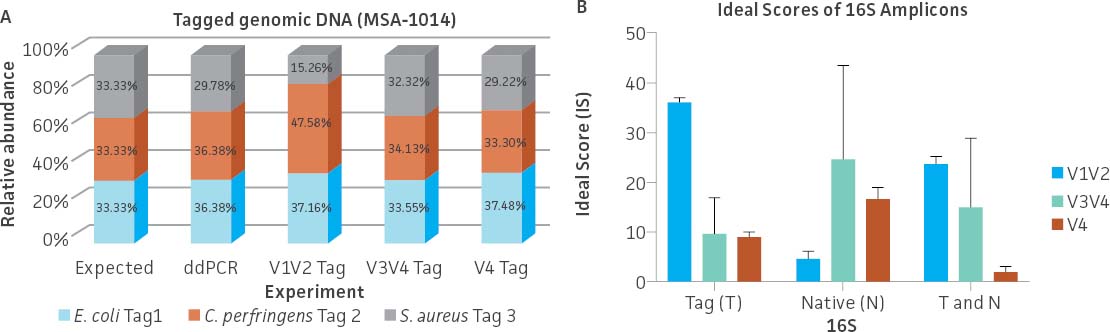
Figure 3. Evaluation of the relative abundance of the tagged genomic DNA by 16S rRNA gene amplicon sequencing and digital PCR (ddPCR). (A) 16S rRNA gene amplicon sequencing was performed on a MiSeq platform (Illumina) using the following primers: V1V2 (27F-YM+3/338R), V3V4 (341F/806R), and V4 (515F/806R).6 The relative abundance was determined based on read counts mapping to the variable regions of the tag sequences; this analysis was performed using Bowtie2 (Geneious 11.1.4 Software). ddPCR was performed using unique primers/probe sets that specifically and independently target the three synthetic tags. Detailed information on the PCR conditions and the ddPCR primers and probes can be found on the product technical data sheet. (B) Average ideal scores (IS) were calculated based on observed taxon relative abundance as determined by analysis of 16S rRNA gene amplicons. T and N: Total amplicon pool including synthetic Tag various region reads and native 16S various reads adjusted by 16S rRNA gene copy number.
Production of the ATCC Spike-in Standards
To develop the spike-in standards, the three tagged strains were prepared as either whole cells (ATCC MSA-2014) or genomic DNA (ATCC MSA-1014) and then mixed together with even relative abundance (Table 2). The relative abundance of the three tagged strains was analyzed by whole-genome shotgun sequencing and ddPCR quantification. An analysis of the data revealed that relative abundance based on the number of the unique tag reads was very similar between the two methods for both standards (Figure 4A). However, when analyzing the whole cell standard (ATCC MSA-2014), a greater distortion from expected was observed. This discrepancy may be due to cell counting or the efficiency of genomic DNA extraction, which is related to the diverse physical properties of the bacterial species (eg, cell wall structure).
Table 2. Specifications and importance of ATCC Spike-in Standards
| ATCC No. | Preparation | Specification* | Importance |
|---|---|---|---|
| MSA-1014 | Genomic DNA | 6 × 10⁷ genome copies/vial |
Microbiome measurements and data normalization 16S rRNA and shotgun assay verification, validation, and quality control |
| MSA-2014 | Whole cells | 6 × 10⁷ cells/vial | Microbiome measurements and data normalization 16S rRNA and shotgun assay verification, validation, and quality control |
*Specification Range: 6 × 10⁷ genome copies/vial ± 1 log. Lot-specific quantitation and relative abundance can be found on the product technical data sheet.
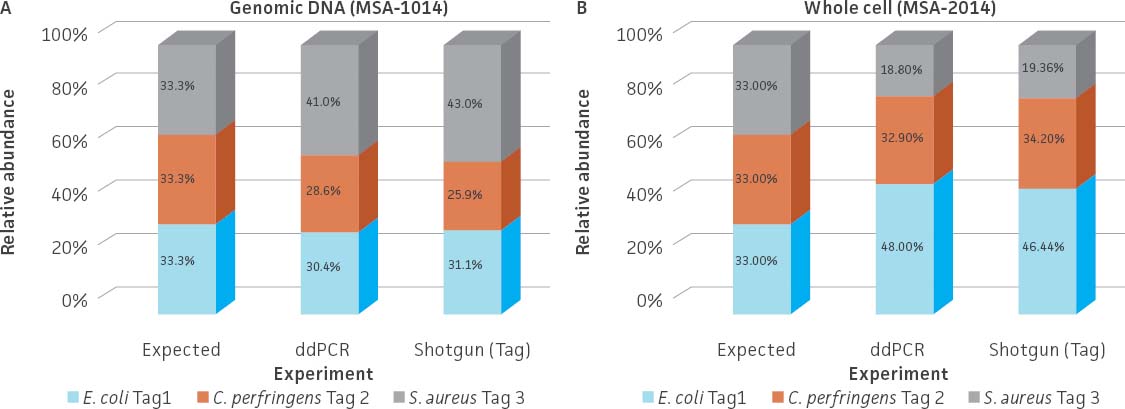
Figure 4. Relative abundance of the genomic DNA (ATCC MSA-1014) and whole cell (ATCC MSA-2014) spike-in standards. Total DNA was extracted from the whole cell spike-in standard (ATCC MSA-2014) by using a DNeasy PowerLyzer Microbial Kit (QIAGEN). Shotgun sequencing of the (A) genomic DNA standard and the (B) extracted DNA from the whole cell standard was performed on the Illumina platform (Nextera XT DNA Library Preparation Kit and NextSeq500 sequencing instrument). Read mapping to the tag sequences was performed via Bowtie2 (Geneious 11.1.4 Software). The relative abundances obtained from shotgun sequencing were compared to those obtained from the ddPCR analysis.
Evaluating the influence of the spike-in standards on abundance profiles
Because E. coli, C. perfringens, and S. aureus are likely to be found in a number of mammalian host-associated microbiome samples, we sought to determine if the spike-in standards would influence observed microbial community structures. To evaluate this, we added the genomic DNA spike-in standard (ATCC MSA-1014) at a final concentration of either 9% or 1% (Table 3) to an even mixture of genomic DNA comprising 10 different species (ATCC MSA-1000); for the purposes of this experiment, we selected a microbial mix containing E. coli. We then performed 16S rRNA gene amplicon sequencing and whole-genome shotgun sequencing in triplicate as previously described above in Figures 2 and 3. Un-spiked genomic DNA (ATCC MSA-1000) was used as control. Following sequencing, the relative abundances were analyzed in the One Codex platform and read mapping of the unique tags was performed via Bowtie2 (Geneious 11.1.4 Software).
Data from both 16S rRNA gene amplicon and shotgun metagenome sequencing showed that the coverage of the unique tag sequence reads could be easily detected in both concentrations evaluated in the spike-in assay (Table 4). When comparing the relative abundance of the un-spiked control to that of the spiked mixtures, we discovered that the addition of the genomic DNA spike-in standard did not have an obvious impact on the relative abundance of the 10-strain bacterial mock community (Figure 5A) even though the divergence between the expected and observed abundance was slightly higher in Mix 1 and Mix 2 as compared to that of the un-spiked control (Figure 5B). When analyzing the shotgun sequencing data, however, we did find that the relative abundance of E. coli in Mix 1 was slightly higher than that in the un-spiked control; this may be attributed to the read count from E. coli Tag 1 (Figure 5C).
Table 3. Total genome copy numbers used in the spike-in study
| Preparations and controls | Genome copy number (ATCC MSA-1014) | Genome copy number (ATCC MSA-1000) | Percentage (%) Spike-in |
|---|---|---|---|
| Mix 1 | 2.33 × 10⁴ | 2.36 × 10⁵ | 9 |
| Mix 2 | 2.33 × 10³ | 2.36 × 10⁵ | 1 |
| Unspiked control | 0 | 2.36 × 10⁵ | 0 |
The estimation of genome copy number used in the mixing experiment was based on theoretical number described in the product specification: ATCC MSA-1014 (6 × 10⁷ genome copy/vial) and ATCC MSA-1000 (2 × 10⁷ genome copy/vial).
Table 4. Read coverage of the unique synthetic tags from the genomic spike-in study
| Samples | Mix 1 V1V2 tag |
Mix 1 V3V4 tag |
Mix 1 V4 tag |
Mix 1 Shotgun (tag) |
Mix 2 V1V2 tag |
Mix 2 V3V4 tag |
Mix 2 V4 tag |
Mix 2 Shotgun (tag) |
|---|---|---|---|---|---|---|---|---|
| Escherichia coli Tag 1 |
1766 | 1981 | 1764 | 396 | 191 | 171 | 201 | 25 |
| Clostridium perfringens Tag 2 | 2211 | 1797 | 1641 | 416 | 277 | 171 | 163 | 24 |
| Staphylococcus aureus Tag 3 | 623 | 2080 | 1317 | 435 | 76 | 188 | 157 | 26 |
The average of total reads from experimental triplicates in Mix 1: V1V2 (1.4 × 10⁵), V3V4 (1.2 × 10⁵), V4 (1 × 10⁵), and shotgun sequencing (3 × 10⁷); and Mix 2: V1V2 (2.6 × 10⁵), V3V4 (1.1 × 10⁵), V4 (1.1 × 10⁵), and shotgun sequencing (2.4 × 10⁷). All numbers presented in the table are rounded.
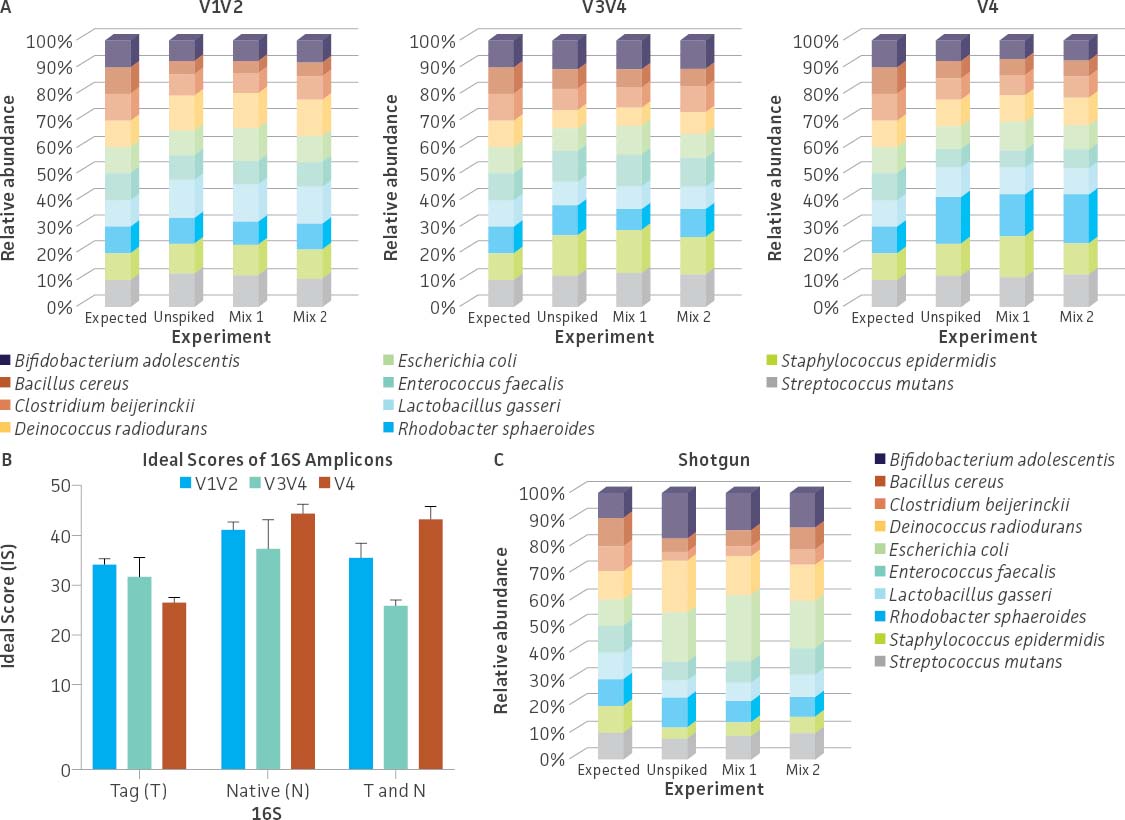
Figure 5. 16S rRNA gene amplicon and shotgun metagenome sequencing profiles of a mock microbial community (ATCC MSA-1000) with or without the spike-in standard (ATCC MSA-1014). (A) 16S rRNA gene amplicon sequencing was performed on a MiSeq platform as described in Figure 3. (B) Divergence between expected and observed abundance was calculated using the IS metric.6 (C) Shotgun metagenome sequencing was performed on an Illumina platform (Nextera XT DNA Library Preparation Kit and NextSeq500 sequencer). Relative abundances from both methodologies were analyzed using the One Codex platform.
We also evaluated the influence of the whole cell spike-in standard (ATCC MSA-2014) on estimating the species abundance within a microbial community. Here, we added the whole cell spike-in standard at final concentrations of 27% and 7% (Table 5) to an even mixture of 10 bacterial strains (ATCC MSA-2003). The un-spiked mock microbial community (ATCC MSA-2003) was used as a control. Similar to our genomic spike-in study, the data generated from both sequencing methodologies revealed that the addition of the spike-in control did not have an obvious impact on the relative abundance of strains within the mock microbial community (eg, un-spiked mix vs. Mix 1 and Mix 2; Figure 6). Further, the coverage of the unique tag sequence reads could be easily detected in spike-in mixtures (Table 6).
Table 5. Total cell concentrations used for spike-in mixtures
| Preparations and controls | Cell number (ATCC MSA-2014) | Cell number (ATCC MSA-2003) | Percentage (%) Spike-in |
|---|---|---|---|
| Mix 1 | 1.5 × 10⁶ | 4.0 × 10⁶ | 27 |
| Mix 2 | 3.0 × 10⁵ | 4.0 × 10⁶ | 7 |
| Unspiked control | 0 | 4.0 × 10⁶ | 0 |
The estimation of cell number used in the mixing experiment was based on theoretical number described in the product specification: ATCC MSA-2014 (6 × 10⁷ cells/vial) and ATCC MSA-2003 (2 × 10⁷ cells/vial).
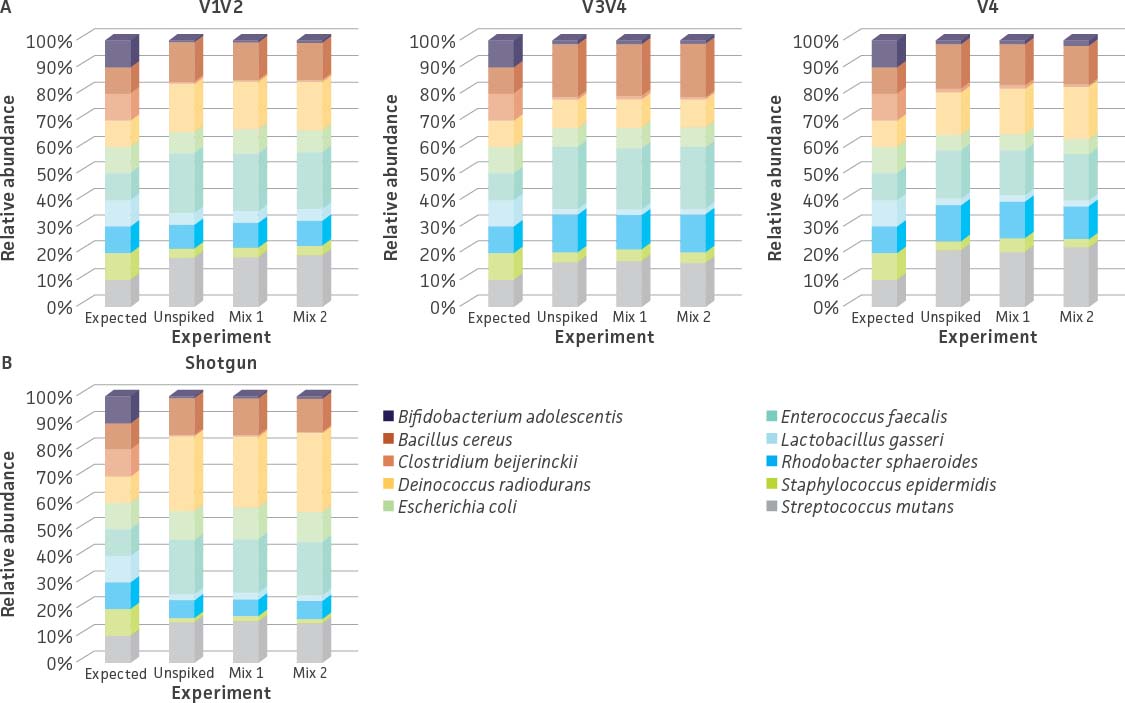
Figure 6. 16S rRNA and shotgun sequencing profiles of a mock microbial community (ATCC MSA-2003) with or without the spike-in standard (ATCC MSA-2014). (A) 16S rRNA sequencing was performed on the MiSeq platform as described in Figure 2. (B) Shotgun sequencing was performed on the Illumina platform (Nextera XT DNA Library Preparation Kit and NextSeq500 sequencing instrument). Relative abundances from both methodologies were analyzed in the One Codex platform.
Table 6. Read coverage of the unique synthetic tags from the whole cell spike-in study
| Samples | Mix 1 V1V2 tag |
Mix 1 V3V4 tag |
Mix 1 V4 tag |
Mix 1 Shotgun (tag) |
Mix 2 V1V2 tag |
Mix 2 V3V4 tag |
Mix 2 V4 tag |
Mix 2 Shotgun (tag) |
|---|---|---|---|---|---|---|---|---|
| Escherichia coli Tag 1 |
278 | 896 | 618 | 70 | 50 | 257 | 122 | 19 |
| Clostridium perfringens Tag 2 | 602 | 1191 | 958 | 155 | 137 | 295 | 226 | 29 |
| Staphylococcus aureus Tag 3 | 121 | 928 | 582 | 84 | 27 | 263 | 147 | 32 |
The average of total reads from triplicate experiment in Mix 1: V1V2 (4.9 × 10⁴), V3V4 (1.2 × 10⁵), V4 (6.7 × 10⁴), and shotgun sequencing (1.6 × 10⁷); and Mix 2: V1V2 (4.7 × 10⁴), V3V4 (1.3 × 10⁵), V4 (6.8 × 10⁴), and shotgun sequencing (1.6 × 10⁷). All numbers presented in the table are rounded.
Data normalization using the internal spike-in control
The ultimate purpose of the spike-in controls is to use them for quantitation within microbial mixes during metagenomic sequencing studies. Here, if we assume that the sequencing process is uniform, the number of tag reads should have a linear correlation with the number of base pairs. Based on this assumption, the relationships among sequence copy numbers and their corresponding reads can be explained by equation (1) below:
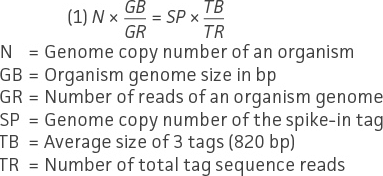
Using equation (1), the genome copy number can then be estimated in a spike-in experiment by using equation (2):
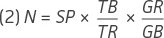
To demonstrate this approach, we performed a proof-of-concept analysis from the data obtained in the spike-in experiments outlined in Table 3 and Table 4. Here, we used the shotgun sequencing data from Mix 1 to estimate the genome copy number of strains within the mock community. Overall, the range of total shotgun reads was between 20 to 30 million reads per sample, and the individual bacterial genome reads were greater than one million reads (data not shown). Using equation (2), we were able to calculate the absolute quantity of genome copies from the 10-strain bacterial mock community (ATCC MSA-1000, Figure 7). The following example is a normalization calculation from one of triplicate shotgun sequencing data for Bifidobacterium adolescentis.
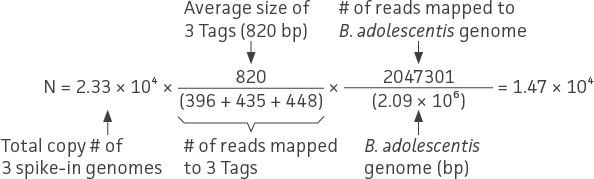
In this particular study, it was inevitable that the E. coli Tag 1 spike-in would contribute to the number of E. coli reads in the mock community (ATCC MSA-1014). Thus, the final quantitation of E. coli was corrected by subtracting the input of the E. coli Tag 1 spike-in control (ie, 7.7 × 10³ genome copies).
In addition to WGS, we performed genome quantification targeted to a single copy gene (RNA polymerase β subunit [rpoB]) of all three tagged strains via ddPCR; the resulting data are summarized in Figure 7. Overall, the ddPCR data appeared to be more accurate (ie, closer to the predicted species concentration) and precise (narrow confidence interval [CI]) than the WGS data (Figure 7A). The WGS experimental data displayed large variations (broad CI) regardless of how close the average values were with respect to the predicted species concentration. The data revealed that the normalized genome copy number of five bacteria within the mix (B. adolescentis, D. radiodurans, E. coli, E. faecalis, and S. mutans) differed approximately ± 2-fold when compared to the quantitative data obtained via ddPCR; the copy number of the five remaining bacteria were all underestimated by 3-fold or more (Figure 7A). These variations might be attributable to the complexity of the genome sequence (eg, repeated sequences and homopolymeric nucleotide runs) and extreme GC content; these factors are known to yield uneven or poor sequencing coverage.7,8 However, in our opinion, this observation alone could not explain the overall observed variation.
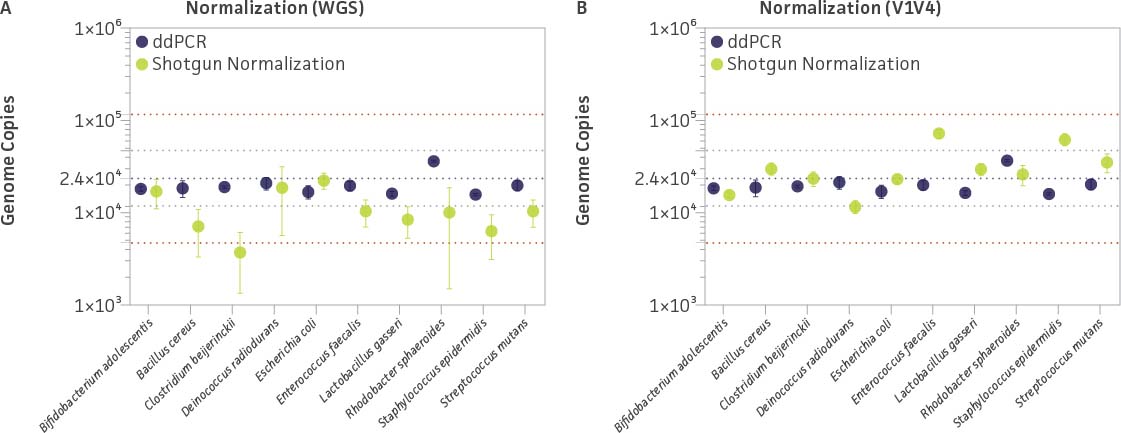
Figure 7. Evaluating ddPCR quantification and genome copy number normalization by using a spike-in internal control within a mock microbial community (ATCC MSA-1000). Genome copy number normalization was performed by mapping the number of reads to either the (A) whole-genome sequence or (B) V1V4 region. The purple dotted line represents the expected genome copy number, the gray dotted lines represent ±25% log (±2.5×) of the expected genome copy numbers, and the red dotted lines represent ±50% log (±5.5×) of the expected genome copy numbers. Whiskers for each datapoint represent ±2 × standard deviation (ie, 95% CI) of the experimental data, which were run in triplicate.
To avoid any potential observed sequence biases, we looked for conserved genomic regions that may improve precision and/or accuracy when calculating the microbial content in the sample. One of these was the 16S rRNA gene. The prokaryotic 16S rRNA gene is evolutionarily conserved, and the percentage GC content among the organisms in the microbial mix (ATCC MSA-1000) is similar (51-59%). To minimize the influence of genome complexity and GC content on sequencing coverage, we performed data normalization by using the number of reads that mapped only to the V1V4 region, which is the same region of the tag sequences.
To normalize the data, we used equation (3), which is a much simpler, modified version of the previous two equations. Here, the following assumptions were made: First, we assumed that the length (bp) of the 16S rRNA V1V4 region is the same in prokaryotes. Second, the quantitation approach focuses only on the V1V4 region; hence, TB=GB and can be removed from equations (1) and (2). Third, since mapping changed from the whole genome to only the V1V4 region, the 16S rRNA gene copy number of a bacterium had to be incorporated into equation (3). The updated formula for genome copy normalization is now simplified as follows in equation (3):
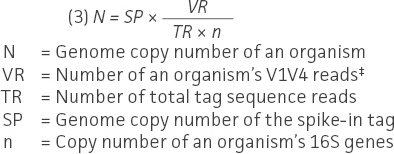
‡ In equations (1) and (2), the VR corresponds to GR.
As summarized in Figure 7B, the V1V4-based sequencing data appear much more precise (narrow CI 95%) and, most importantly, more accurate than those based on the WGS. According to this approach, only two bacteria (E. faecalis and S. epidermidis) appear to have a higher genome copy estimation than predicted (beyond ±2.5× predicted concentration). Since the V1V4 sequence identity between S. aureus Tag 3 and S. epidermidis is around 98%, and the V4 region is 100% identical, it is very likely that a portion of the reads mapped to S. epidermidis might be attributed from S. aureus, which contains six copies of the 16S rRNA gene. The higher genome copy estimation for E. faecalis was unexpected since the relative abundance from the 16S and WGS data were close to the expected ratio in the microbial mix (Figure 5). Interestingly, the higher genome copy estimation of E. faecalis was also observed by mapping E. faecalis V5V9 reads (data not shown).
Discussion
In this study, we demonstrated that the tagged spike-in controls can be used for the absolute quantitation and normalization of microbial abundance in microbiome samples using two normalization approaches (ie, mapping against the WGS or the V1V4 region). We show that the V1V4-based quantification approach is not only simpler than the WGS approach but can also generate more accurate and precise results. However, researchers need to be aware that this method relies on the 16S rRNA gene copy number as the sole prerequisite for the calculation. It must also be noted that while the genome sequence of the tagged bacterial strains could potentially influence the relative abundance and quantification for certain biological samples that contain the same genera, the impact can be greatly reduced with a lower, yet tag-detectable, concentration of the spike-in control. Since the tag sequences could be easily detected by both 16S and WGS in a 1% spike-in assay (Table 4), we believe that a lower spike-in concentration (eg, 0.1%) could still be feasible for detection. Overall, the unique synthetic 16S rRNA gene tag sequences of ATCC Spike-in Standards provide an easily detectable internal control for monitoring the sensitivity (eg, limit of detection) and reproducibility of a microbiome analysis workflow from sample process through data analysis.
Download a PDF of this application note
Download nowReferences
- Hardwick SA, Deveson IW, Mercer TR. Reference standards for next-generation sequencing. Nat Rev Genet 18: 473–484, 2017.
- Chen K, et al. The Overlooked Fact: Fundamental Need for Spike-In Control for Virtually All Genome-Wide Analyses. Mol Cell Biol 36: 662–667, 2016.
- Stämmler F, et al. Adjusting microbiome profiles for differences in microbial load by spike-in bacteria. Microbiome 4: 28, 2016.
- Hardwick SA, et al. Synthetic microbe communities provide internal reference standards for metagenome sequencing and analysis. Nat Commun 9(1): 3096, 2018.
- Green SJ, Venkatramanan R, Naqib A. Deconstructing the polymerase chain reaction: understanding and correcting bias associated with primer degeneracies and primer-template mismatches. PLoS One 10(5): e0128122, 2015.
- Frank JA, et al. Critical evaluation of two primers commonly used for amplification of bacterial 16S rRNA genes. Appl Environ Microbiol 74: 2461–2470, 2008.
- Hillier LW, et al. Whole-genome sequencing and variant discovery in C. elegans. Nat Methods 5: 183–188, 2008.
- Kozarewa I, et al. Amplification-free Illumina sequencing-library preparation facilitates improved mapping and assembly of (G+C)-biased genomes. Nat Methods 6: 291–295, 2009.